

Reading the Plans Together: A Case Study in KPI Alignment
Fifteen department tactical plans, read side by side against the enterprise KPIs, and how the review changed the way the executive team meets.
A department plan can be complete and still not move an enterprise number. Fifteen department tactical plans were read side by side against the enterprise KPIs, and the review changed how the executive team meets.
How the Review Was Run
- The dashboard. Five enterprise measures, each with status and trend.
- Departments. Which plan targets which KPI, and where a department could move a KPI without saying so.
- Connecting the dots. Which dependencies are confirmed both ways, and which efforts are already joined up.
- Opportunities. Cross-functional plays that link work already planned, released in waves.
- Roadmap and plan hygiene. Whether plans, roadmap and current results agree.
- Redesign of the forum. A meeting built around KPI ownership instead of department updates.
What to Take from It
- A complete plan can leave a red KPI without an owner. One page, the coverage map, finds it.
- A dependency is real only when both teams confirm it. Six in ten were one-way, and most landed on the same few hub teams.
- Plays connect work that is already planned. Their order is set by the capacity of the teams that sit in most of them.
- Plans, roadmap and results have to agree. Five date mismatches and a short list of hygiene defects made the plans hard to compare.
- A meeting built around KPI ownership turns diagnostics into decisions. Pods own the KPIs, the forum owns the commitments, and every department can say which number it moves.
Read the full case study
A department plan can be complete and still not move an enterprise number. This case study shows what happened when fifteen department tactical plans were read side by side against the enterprise KPIs, and how that changed the way the executive team meets.
The Situation
A mid-sized financial institution had a strategic plan with a short list of enterprise KPIs and a one-year tactical plan from every major department, all on one template. The monthly executive operating review, called Run the Business (RTB), was built around production results and department updates.
Three things were true at the same time:
- Several enterprise KPIs were red or yellow, and the plans did not clearly say who owned them.
- Support departments (technology, risk, accounting, payments) saw no role in growth KPIs and reported only internal service levels.
- Teams listed each other as dependencies, but few of those dependencies were confirmed in writing by the team being asked.
The question for the review was specific: read together, do the plans explain the results, and do they show who needs whom?
How the Review Was Run
The review followed six steps, in this order. Each step produced a view the executive team could act on.
- The dashboard. Five enterprise measures, each with status and trend.
- Departments. Which plan targets which KPI, and where a department could move a KPI without saying so.
- Connecting the dots. Which dependencies are confirmed both ways, and which efforts are already joined up.
- Opportunities. Cross-functional plays that link work already planned, released in waves.
- Roadmap and plan hygiene. Whether plans, roadmap and current results agree.
- Redesign of the forum. A meeting built around KPI ownership instead of department updates.
The figures below are rounded or indexed to goal. The structure and the findings are as they were.
Step 1: The Dashboard
The review opens with five enterprise measures on one page. Each shows status, position against goal and direction. Every step after it asks the same question: which plans explain these results, and which do not?
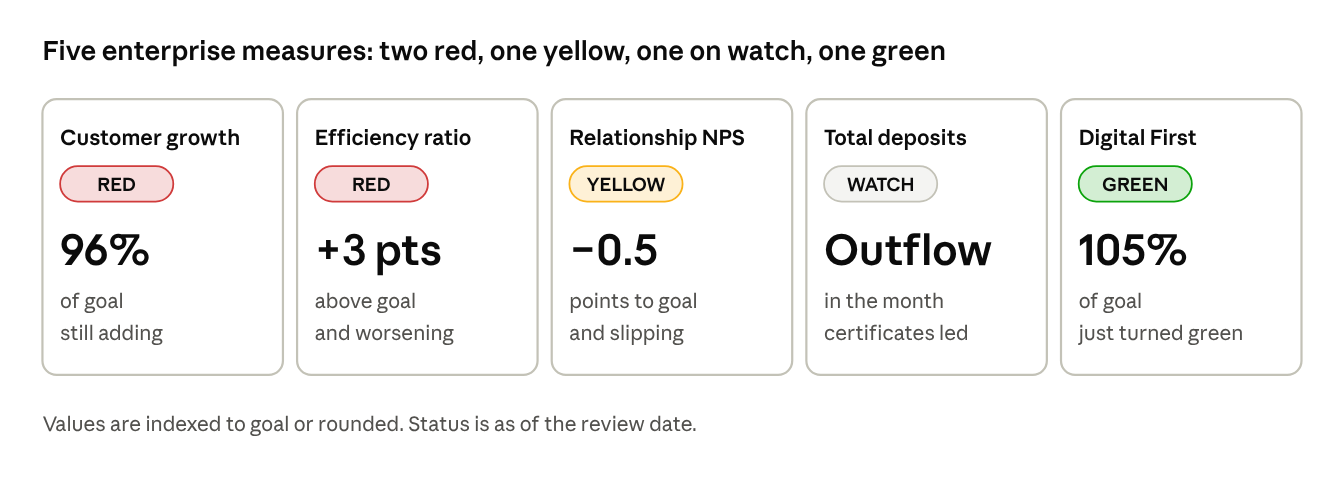
Three facts from the dashboard shaped the rest of the review. The efficiency ratio was red and worsening, yet no department had a target for it. Deposits had fallen in the month while assets grew, so the growth was being funded with borrowings. And digital adoption had just turned green, with no plan assigned to keep it there.
The dashboard also set the agenda for the four sections that follow: departments, connecting the dots, opportunities, and roadmap and plan hygiene.
Step 2: Departments
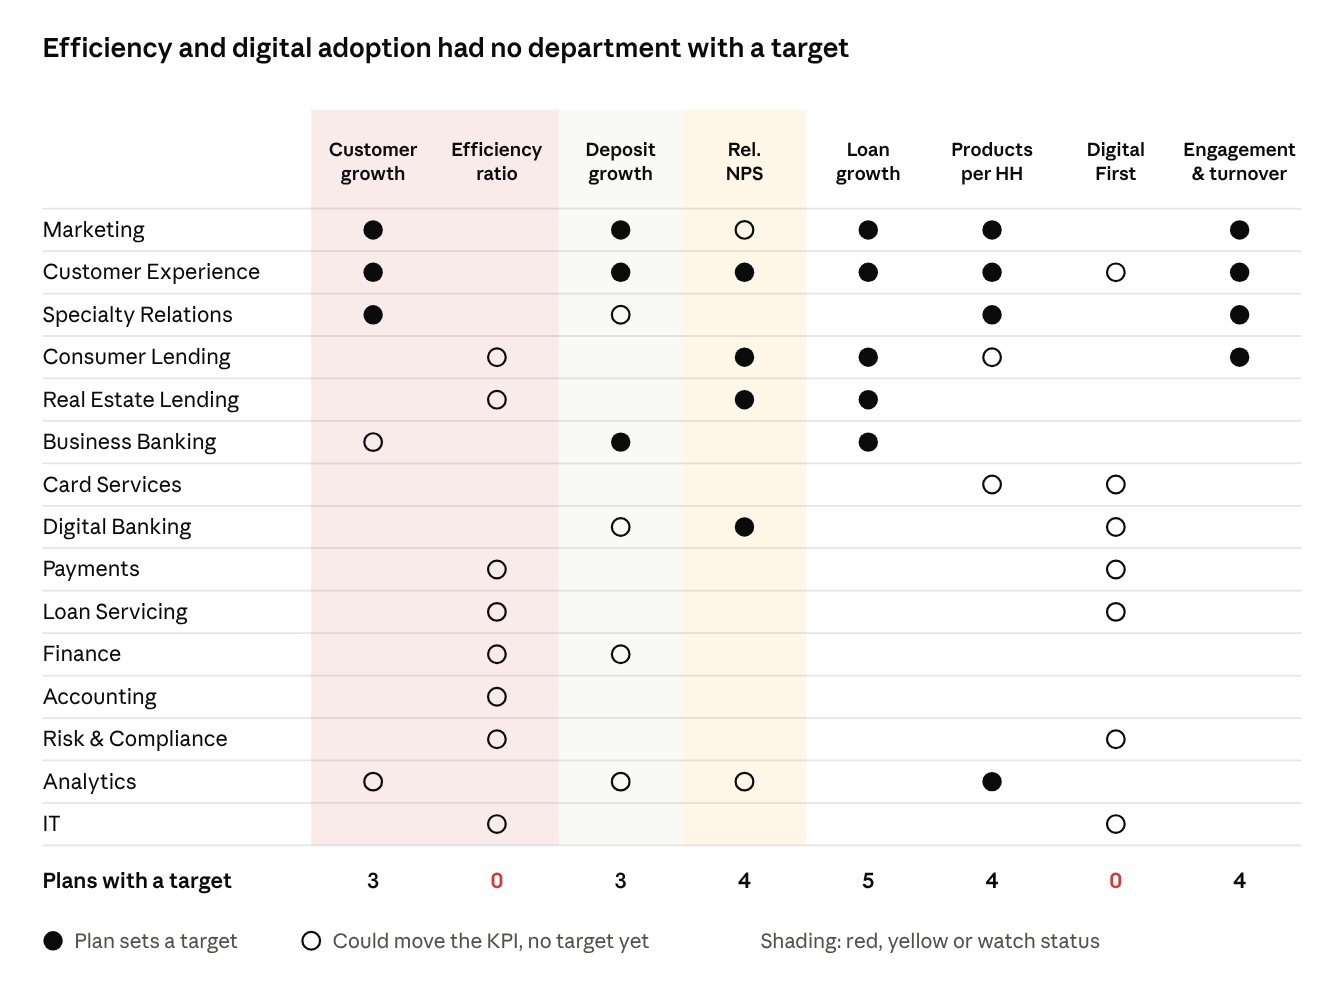
The coverage map lays the fifteen department plans against the enterprise KPIs. A filled circle marks a plan with a numeric target for that KPI. An open circle marks a department that could move the KPI through planned work or its daily role, but sets no target.
Four readings came out of the map.
A red KPI with no owner in practice. The efficiency ratio was red, and no plan targeted it. Eight departments could have moved it.
A green KPI no one is asked to keep. Digital adoption had no target in any plan, although seven departments touched it.
Departments outside the production conversation. Seven further departments had no tactical plan at all, including HR, while turnover was rising.
Hubs. Marketing and customer experience carried targets on most KPIs, which made them the teams every other plan would lean on.
What Each Department Can Bring
The map is followed by one page per KPI that needs attention. Each page has the KPI tile, one line on why it matters now, a question for the room, and a table of every department's role: the plan target it already holds, or the specific way it could move the KPI.
| Department | Role | What it brings to the KPI |
|---|---|---|
| Branches | ● Target in plan | Call customers whose certificates mature in the next 90 days and track retention weekly |
| Business banking | ● Target in plan | Lead business deposit gathering and attach operating accounts to every business loan |
| Digital channel | ○ Could move it | Make certificate renewal and savings opening simple online so customers do not leave at maturity |
| Finance | ○ Could move it | Price renewals with the asset-liability committee so offers are competitive and profitable |
| Analytics | ○ Could move it | List maturing certificates and at-risk balances, and explain deposit swings in the monthly pulse |
Example page: total deposits.
The open circle is the useful mark. Turning it into a target is how a support function arrives at the executive forum with a number instead of a status.
Step 3: Connecting the dots
Every plan lists the teams its department needs. Reading those lists in both directions shows which dependencies are real. An ask made is a team a department lists under cross-functional resources needed. An ask received is the same relationship from the other side: the teams that list it.
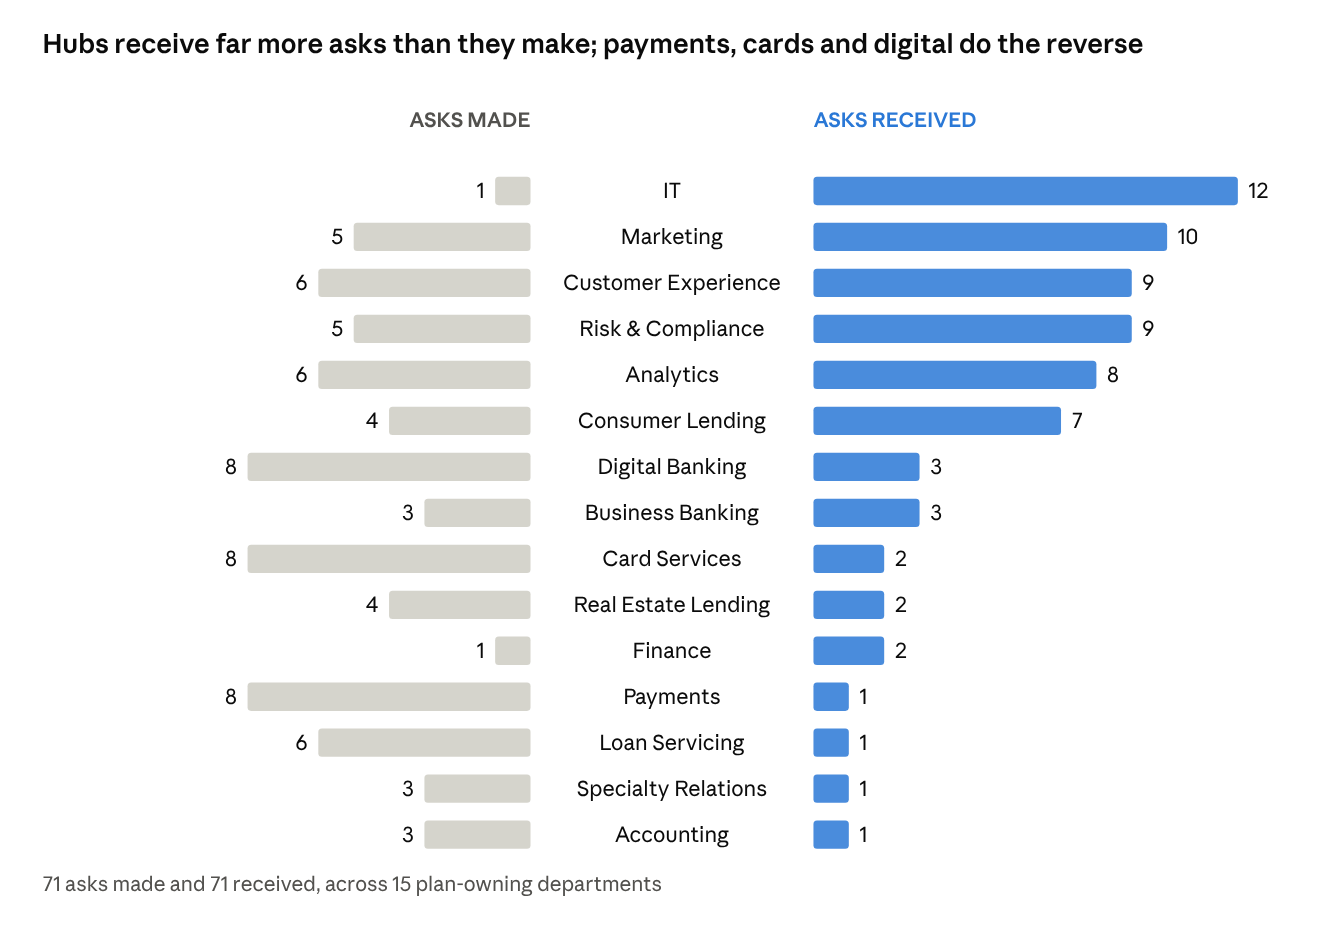
Of 71 cross-team dependencies among plan-owning departments, 28 (39%) were reciprocated, meaning both teams listed each other. The other 43 (61%) ran one way.
The pattern is consistent. IT, marketing, customer experience, risk and analytics are hubs that most other departments depend on. Payments, card services, digital banking and loan servicing rely on partners who may not have planned for them.
Asks Waiting on Each Hub
| Hub | Asks waiting | Teams whose asks are not in the hub's plan |
|---|---|---|
| IT | 11 | Marketing, customer experience, payments, card services, accounting, digital, analytics, consumer lending, loan servicing, business banking, real estate lending |
| Marketing | 6 | Payments, card services, consumer lending, loan servicing, business banking, real estate lending |
| Customer experience | 5 | Specialty relations, payments, card services, digital, real estate lending |
| Consumer lending | 5 | Specialty relations, payments, card services, accounting, digital |
| Risk & compliance | 4 | Payments, card services, analytics, loan servicing |
| Analytics | 4 | Card services, digital, loan servicing, real estate lending |
The decision rule: each hub confirms or declines every waiting ask, in writing, in the revised plans. A declined ask is a valid answer. An unanswered ask is not.
Efforts Already Joined Up
The same read shows where teams are already working together. Each effort is classed by how completely it is connected.
| Class | Test | Count | Example and watch-out |
|---|---|---|---|
| Strong | Both teams list each other and a roadmap project ties them together | 8 | Digital card issuance: the roadmap said Q2, both plans said Q3, and the date depended on a platform decision |
| Strong | As above | Profitability reporting: finance, analytics, customer experience and marketing aligned, but analytics reached finance data only in the same quarter as go-live, a capacity risk | |
| Partial | One side lists the other, no roadmap item exists, or one department owns it alone | 5 | Customer attrition model: built in analytics and used by marketing, but branches and the contact center did not act on the scores |
| Fragmented | Many teams name the same item, no shared definition of what it must do | 1 | CRM: six teams named it, each for a different reason, with different dates and no shared requirements |
The eight strong efforts were proof that connections were already forming. The fragmented one became a play in Step 4.
Step 4: Opportunities
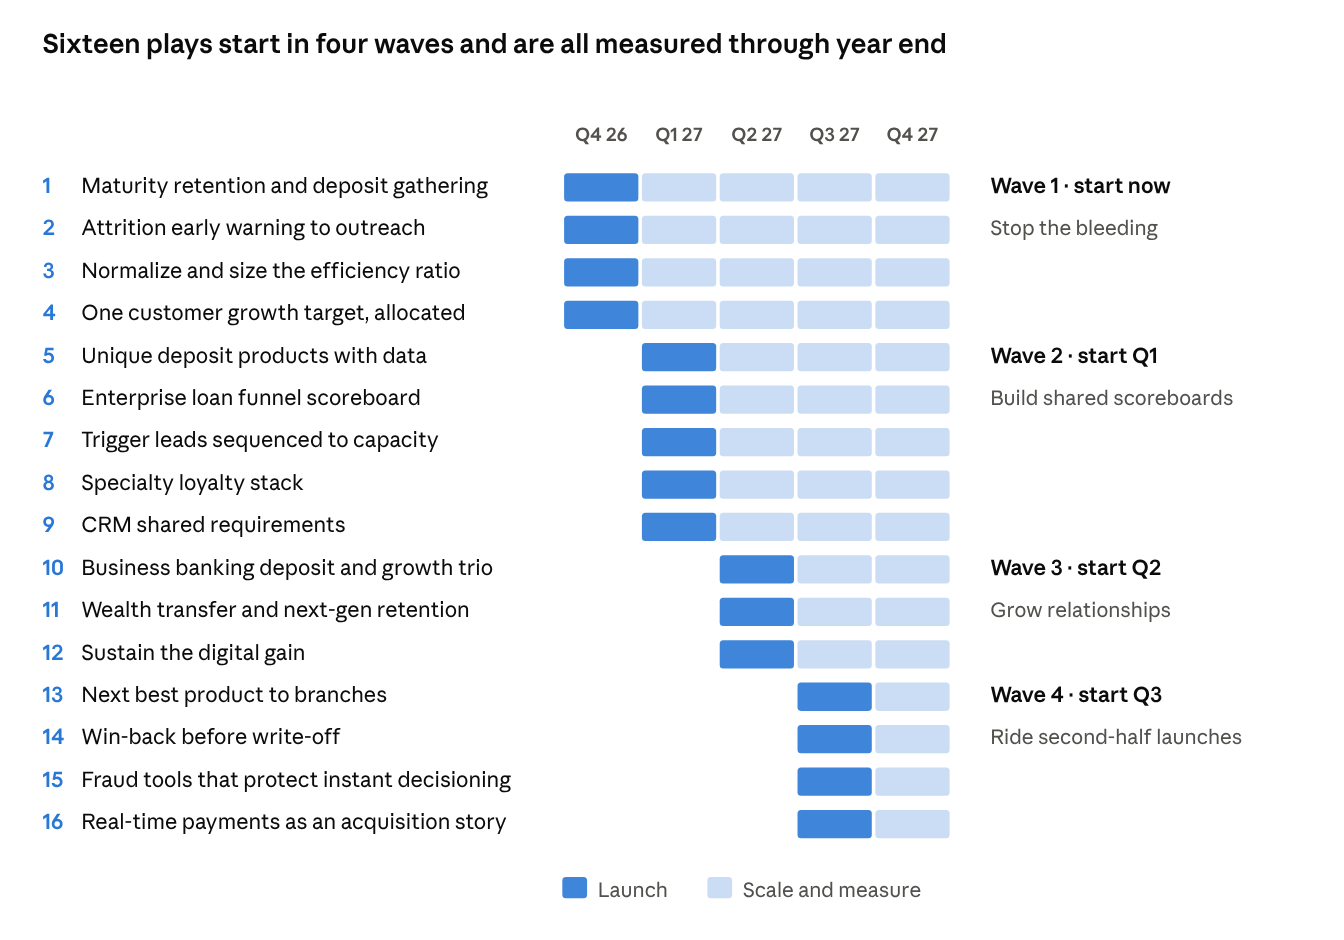
The gaps from Steps 2 and 3 became plays. A play is a specific action that links work already in two or more departments' plans to move an enterprise KPI. Each has a lead, a first step and a start wave. Nothing in a play is new work for its own sake: it connects what is already planned.
Sixteen plays came out of the review. Nine moved customer growth, eight grew or retained deposits and three moved the efficiency ratio.
Why Waves
Sixteen plays cannot all start at once, because the same few teams sit in most of them. Marketing was in fourteen plays, customer experience in ten and analytics in nine. Marketing showed zero project capacity in three of four quarters, and analytics was already at its weekly limit. Start dates followed the plans and the roadmap, and the weakest KPIs went first.
| Wave | Start | Intent |
|---|---|---|
| 1 | Now | Stop the bleeding: deposits, expenses, attrition and one growth target |
| 2 | Next quarter | Build the shared scoreboards and launch plays already on the next quarter's roadmap |
| 3 | Two quarters out | Grow deposits and relationships as mid-year launches arrive |
| 4 | Three quarters out | Ride the second-half launches: recommendations, card reactivation, fraud tools and real-time payments |
An agreed capacity split for the shared analytics team (for example 60% models, 25% monitoring, 15% ad hoc) kept the plays from competing silently, and each hub confirmed or declined its asks in writing.
Wave 1 at a Glance
| # | Play | KPIs moved | Lead | First step |
|---|---|---|---|---|
| 1 | Maturity retention and deposit gathering | Deposits, growth, NPS | Customer experience (execution), finance (pricing) | Analytics lists certificates maturing in the next 90 days. Track retention weekly. |
| 2 | Attrition early warning to outreach | Growth, deposits, NPS | Analytics and customer experience | Pilot one at-risk segment for 60 days against a holdout |
| 3 | Normalize and size the efficiency ratio | Efficiency | Finance | Report a ratio that separates one-time from run-rate cost |
| 4 | One customer growth target, allocated | Growth | Analytics, with marketing and customer experience | Replace separate departmental targets with one waterfall |
One Play in Full
Every play is documented on a one-page card with the same fields. This is Play 1.
| Field | Entry |
|---|---|
| What it is | Keep maturing certificate money and bring in new deposits. Customers get a call and a competitive renewal offer before maturity, not a notice after. |
| Why now | Deposits fell in the month, led by certificates, and borrowing filled the gap. Certificates mature every month, so waiting costs balances. |
| How it works | 1. Analytics lists certificates maturing in 90 days, with balance and tenure. 2. Finance sets renewal offers against the cost of borrowed funds. 3. Branches and the contact center call about 30 days before maturity, and digital makes online renewal easy. 4. Marketing runs a deposit campaign and business banking targets business deposits. |
| Measures | Certificate renewal rate, net deposit change per month, borrowed funds balance |
| Lead | Customer experience (execution), finance (pricing) |
Step 5: Roadmap and plan hygiene
Plans, the enterprise roadmap and current results should say the same thing. This step checks four ways they might not, and assigns a fix to each before budgets lock.
Check 1: Coverage
Every roadmap project is counted by how many tactical plans reference it. Of 32 projects, 14 appeared in two or more plans, 10 in one plan only, and 8 had weak or no coverage.
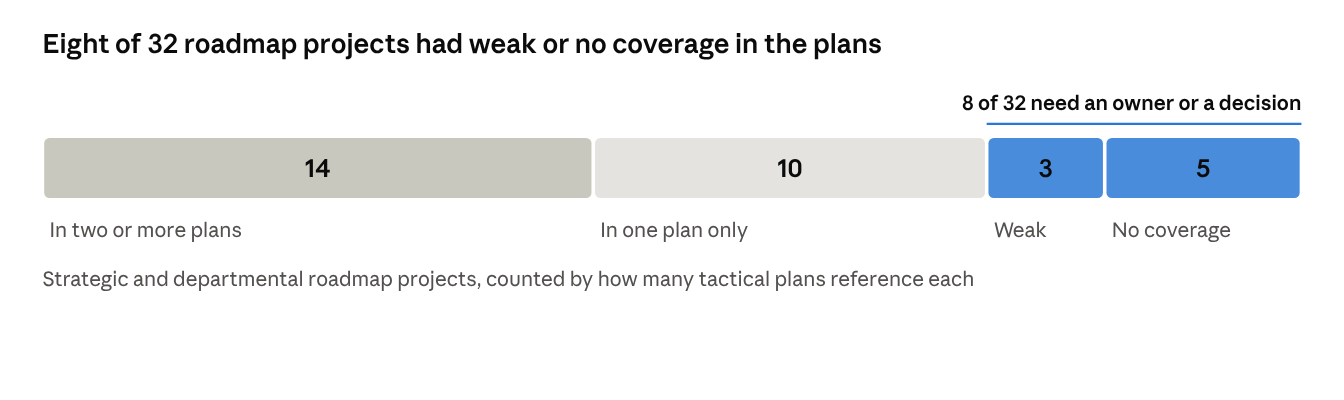
A project in two or more plans has a partner. A project in one plan may affect teams that have not been asked. A project with weak or no coverage needs an owner or should leave the roadmap.
Check 2: Date Mismatches
The roadmap due date is compared with the date each owning plan states. Five projects disagreed.
| Project | Roadmap says | Plans say | Decision needed |
|---|---|---|---|
| Digital card issuance | Q2 | Q3 | Which date is real, and what does the platform decision gate? |
| CRM | Q4 | Q1 of the following year (analytics) | One owner, one date, one requirement set |
| Trigger leads for mortgage and auto | Q1 | Q3 for auto triggers | Does capacity support the earlier date? |
| Savings round-up feature | Review | Implement in Q4 | Is it approved to build? |
| Mortgage origination system review | Q4 | Pain reported all year | Move the review forward? |
Check 3: Timing Against Current Results
Due dates are compared with the latest KPI and financial results. A project that looks late given a red or falling KPI is a candidate to move forward.
| Roadmap item | What the results say | Recommendation |
|---|---|---|
| Deposit product review (Q4) | Deposits fell, led by certificates | Consider Q1 |
| Profitability reporting (Q3) | Efficiency ratio red and worsening | Keep the date. Publish interim views sooner. |
| Selling loan participations (Q2) | Assets grew while borrowing funded the gap | Consider Q1, since sales free liquidity |
| Real-time payments (Q4) | Deposits need acquisition levers | Keep the date. Add a deposit acquisition goal. |
Check 4: Plan Hygiene
Small corrections that make plans comparable. Run them before the executive review.
| Defect found | Correction |
|---|---|
| One plan labeled for the wrong year. Another mixed quarter columns from two years. | One year and quarter label set across every plan |
| A lending plan had production goals marked TBD and portfolio growth at zero | Set targets, or record the date they will be set |
| Executive team requests blank in every plan | Require an entry or an explicit "none" |
| CTB action plan blank or N/A in six plans | Require an entry wherever a dependency exists |
| KPIs written qualitatively ("increase usage") | Replace with a number and a unit |
| Marketing showed zero project capacity in three quarters but about seven projects on deck | Reconcile capacity to project count |
| Every roadmap project scored zero | Score every project, so capacity disputes are settled by a neutral method |
None of these takes more than an afternoon. Together they decide whether the plans can be compared at all.
Step 6: Redesigning the forum
The diagnostics only hold if the meeting that acts on them changes. The redesign moves the executive forum from department updates to a working session on enterprise KPIs, with ownership assigned.
Change the Lens: Run and Grow the Business
A production-only mission leaves support functions with nothing to contribute. The forum keeps its name and changes its mission to Run and Grow the Business. One question applies to every department: which enterprise KPI do you move, and who do you need to move it?
A quarterly theme rotates under the same meeting and sets which KPIs get the deep-dive time.
| Quarter | Theme | KPIs in focus |
|---|---|---|
| Q1 | Customer growth and retention | Net growth, relationship NPS |
| Q2 | Deepen relationships | Products per household, loan and deposit growth, non-interest income |
| Q3 | Digital adoption and efficiency | Digital adoption, efficiency ratio |
| Q4 | People and readiness for next year | Turnover, engagement, capacity for next year's roadmap |
Growth Pods
A growth pod is a standing team of four to six people from different departments who share one enterprise KPI and meet every two weeks between executive sessions. Pods turn "we should work together" into a shared scoreboard. The review started with three.
| Pod | Shared KPI | Lead | Members | First plays |
|---|---|---|---|---|
| Customer growth and retention | Net customer growth | Customer experience | Marketing, analytics, specialty relations, business banking, contact center, digital | Attrition early warning to outreach. Wealth-transfer campaign. Retention of newly acquired customers. |
| Digital First | Digital adoption | Digital banking | Branches and contact center, payments, card services, loan servicing, marketing, risk, IT | Digital wallet and issuance push. E-notifications. Higher online limits. Branch digital coaching. |
| Loan funnel and throughput | Look-to-book and pull-through by product | Consumer lending | Real estate lending, business banking, marketing, analytics, process excellence, IT | Stage-by-stage funnel view. Trigger leads sequenced to capacity. Origination-system pain-point backlog. |
Two further pods were held for a second phase: deepen relationships (products per household), led by lending, and efficiency, led by finance.
Show Every Department Where It Fits
Teams need a picture of where their daily work shows up. One driver tree is built for each red KPI, and every department locates itself on it.
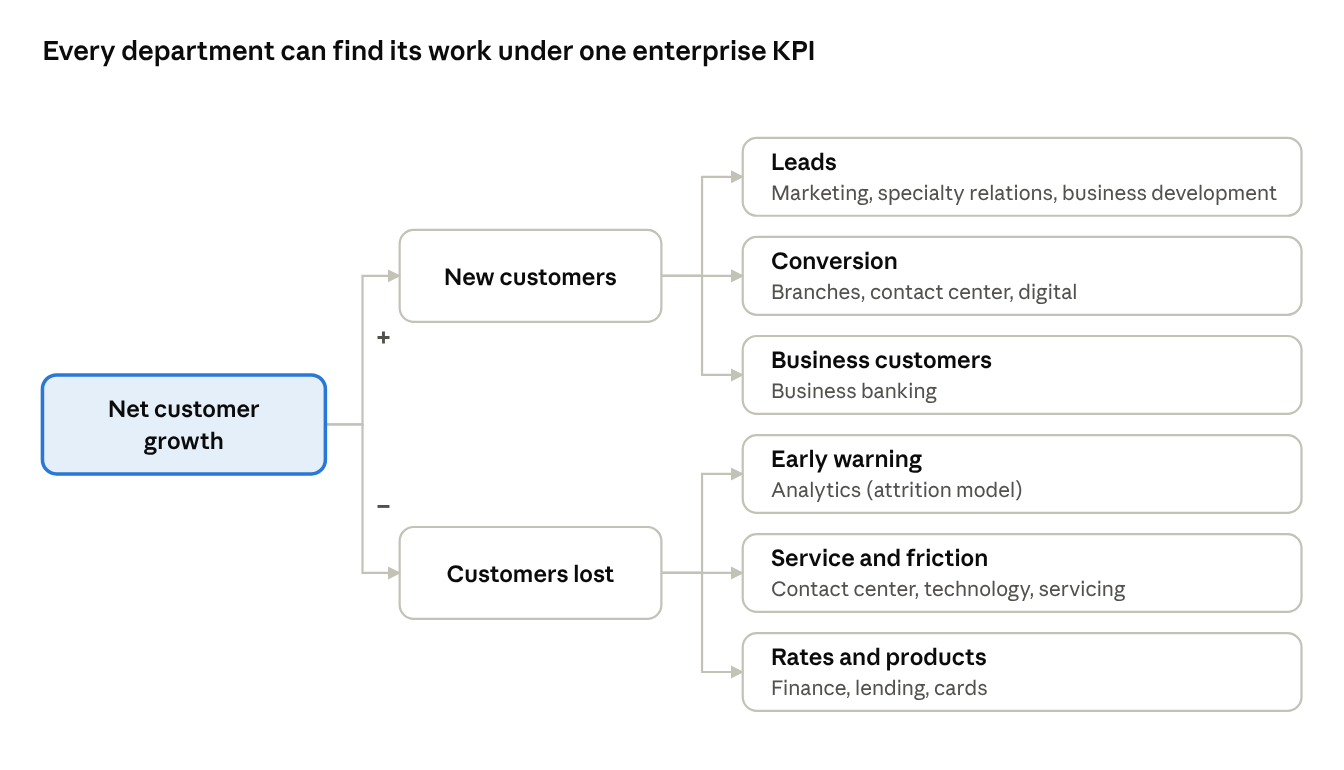
Each department then writes one sentence, updated each quarter:
My team moves [enterprise KPI] through [driver] by [action]. To do it we need [specific thing] from [team] by [date], and we give [specific thing] to [team].
Example, technology: "Technology moves digital adoption and the efficiency ratio through system availability and automation, by delivering biometric login and the service-desk replacement. We need prioritized requirements from the digital channel by Q1."
The New Monthly Agenda
Status-only updates move to a pre-read. The 60 to 90 minutes are spent on decisions, partners and commitments.
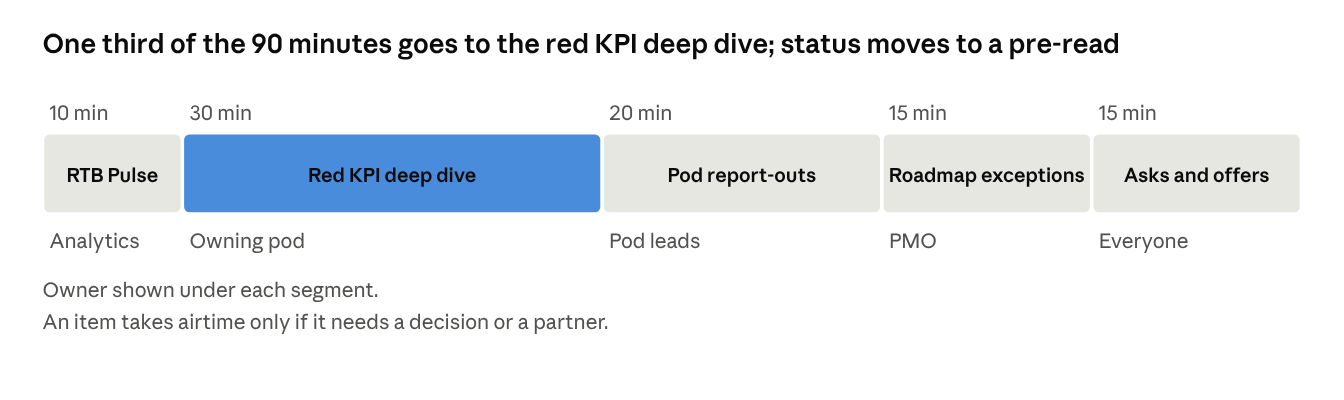
Every executive closes the session by stating one ask and one offer. The PMO logs the owner and the date in the tracking tool. The commitment log is the output of the meeting: if it is empty, the meeting did not work.
What Each Department Brings
The review closed with one line per department: the gap in its plan, and what to bring to the forum.
| Department | Gap in the tactical plan | What to bring |
|---|---|---|
| Marketing | Zero capacity in three quarters, yet several projects on deck | Co-own the enterprise funnel scoreboard. Confirm or decline each team's ask in writing. |
| Technology | Sees no production role | Report revenue-system health. Commit named capacity to revenue systems. Join the digital pod. |
| Analytics | No recurring enterprise monitoring | Deliver the monthly pulse. Assign an analyst to each pod. Run scored intake. |
| Finance | Profitability model not framed as a forum tool | Give the forum a product, branch and customer profitability lens. Size every efficiency project. |
What to take from it
The review was prepared for the executive team ahead of the next planning cycle. Five findings carry beyond this organization.
- A complete plan can leave a red KPI without an owner. One page, the coverage map, finds it.
- A dependency is real only when both teams confirm it. Six in ten were one-way, and most of them landed on the same few hub teams.
- Plays connect work that is already planned. Their order is set by the capacity of the teams that sit in most of them, not by their appeal.
- Plans, roadmap and results have to agree. Five date mismatches and a short list of hygiene defects were enough to make the plans hard to compare.
- A meeting built around KPI ownership turns diagnostics into decisions. Pods own the KPIs, the forum owns the commitments, and every department can say which number it moves.
Run It in Your Organization
The plan template and the first two steps of this method are in the playbook From strategic plan to Monday morning. The full operating method, including the diagnostics, play cards, wave boards and templates, is available as an operational guide on request.